COLLECTION NAME:
David Rumsey Historical Map Collection
Record
Author:
Brault, Louis-Deìsireì-Leìon (1839 - 1885)
Author:
Depot de la Marine
Date:
1876
Short Title:
Octobre, Novembre, Decembre. Atlantique Sud - Cartes De La Direction Et De L'Intensite Probables Des Vents Par L. Brault . . . 1876
Publisher:
Depot de la Marine
Publisher Location:
Paris
Type:
Chart Map
Obj Height cm:
65
Obj Width cm:
92
Scale 1:
8,540,000
World Area:
Atlantic
Subject:
Data Visualization
Subject:
Weather
Full Title:
Octobre, Novembre, Decembre. Atlantique Sud - Cartes De La Direction Et De L'Intensite Probables Des Vents Par L. Brault . . . 1876
List No:
15038.000
Publication Author:
Brault, Louis-Deìsireì-Leìon (1839 - 1885)
Publication Author:
Depot de la Marine
Pub Date:
1876
Pub Title:
Octobre, Novembre, Decembre. Atlantique Sud - Cartes De La Direction Et De L'Intensite Probables Des Vents Par L. Brault . . . 1876
Pub Reference:
Arnold Court, “La Rose des Vents Segmentaire de Léon Brault (1839-1885)” La Météorologie 8 serie (avril 1995): 118-125; Marc I. Pinsel, “The Wind and Current Chart Series Produced by Matthew Fontaine Maury” Navigation 28, no. 2 (1981): 123-137; W. M Davis, “The Older Wind Charts of the North Atlantic” Science (May 16, 1884): 593-597
Pub Note:
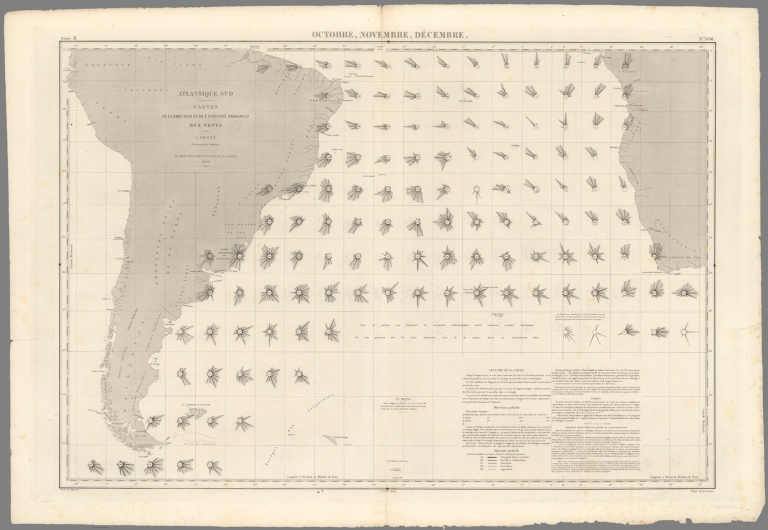
"The Emergence of Oceanic Science—An Innovative French Wind Chart Fine example of Brault’s wind charts, this one covering the South Atlantic, and meant to aid navigators. It was part of a series of four charts that each covered one season of three months; this one represents the winds in the austral spring (October, November, December). The chart brings together a wealth of data into one document, allowing the captain or officer to plot a course and reference information with ease. The chart was made during a golden age of wind charting, thanks to the work of Matthew Fontaine Maury and the maker of this chart, Léon Brault. The sea between South America and Africa is overlaid with a grid; each square is filled with a round symbol. This is Brault’s compass rose. The inner circle has a number, which is the number of observations gathered for that area. Each circle is ringed with radiating spokes, or arrows, as Brault calls them, which indicate the direction and intensity of the winds in that quadrant. The arrow that is longest for each compass rose indicates that it is the direction in which the wind blows most frequently. These arrows are to scale, so if one is half the length of another, the wind gusts in that direction half as often. As Brault summarizes in his explanation in the lower right, “in a nutshell: in each rectangle the lengths of the arrows of the polygon are proportionate to the frequency of the winds they represent.” To gauge the intensity of the wind, one must look at the five segments of each spoke. The solid black segment indicates strong, fresh winds; the solid line flanked by two white lines indicates strong or fresh breezes; the dotted line a nice breeze; the solid white line a gentle breeze; and the thin black line a light breeze. The proportion of each segment on the spoke indicates its frequency. Any sailor worth their salt knows that sometimes the winds do not blow. Brault has prepared for this eventuality as well. On some of the compass roses there is a concentric circle ringing the interior one. The combined circumference of these circles indicates the probability of calms in that space; if the circumferences reach ¼ of the way up the longest of the arrows, then there is a 25% chance of calms there. In Brault’s words, “In other words: we take the ratio of the distance of the two circumferences to the length of the largest arrow, and this ratio will give as much % [sic.] of the probability of the calms in the rectangle considered.” Some areas have a simpler compass rose, which is mounted with only arrows indicating direction. These are areas where little information is available and they do not indicate intensity. In other quadrants, mainly in the far south, there are no compass roses. These are “parages non fréquentés,” or areas not frequented often enough to gather the necessary data. While Brault made similar charts for all the world’s oceans, he does have some specific notes for the South Atlantic. In the North Atlantic chart, also first published in 1874, Brault had depended solely on French sources. However, for the South Atlantic, he has had to include American sources to ensure that enough information was available. Those quadrants based solely on French sources have their central number written in bold, while those that also include American sources are written in italics. These American sources were gathered by Brault’s counterpart, Matthew Fontaine Maury, who had pioneered his own wind charts at mid-century. Charting the Winds Brault’s mention of Maury suggests a longer history of wind charts. Attempts to trace the currents and winds go back centuries and include Athanasius Kircher’s 1665 world map that traced the oceanic currents. Edmond Halley, the famed astronomer, published a map of the trade winds in the Philosophical Transactions of the Royal Society in 1686. William Dampier, the pirate and navigator, published A discourse of winds, breezes, storms, tides and currents (1699), which included maps. In the eighteenth century, including wind arrows became more common on sea charts and even on general maps like Moll’s world map (1729). However, including wind arrows meant that the map or chartmaker was making a claim as to how the wind usually acted in a specific place. To make these claims, it was necessary to aggregate information from numerous journals and logs—not an easy task! Winds are also unpredictable and changeable, so including a wind arrow that might then mislead a navigator was a risk. Precisely how to overcome these issues was taken up by naval officers and oceanic scientists in the nineteenth century. Matthew Fontaine Maury, Officer in Charge of the Depot of Charts and Instruments for the U.S. Navy, devised a system whereby he gathered all the data he could from the Merchant Marine and the United States Navy. He compiled this information into a series of charts called the Wind and Current Chart Series, which was published between 1847 and 1860. He explained the problem and his solution in The Physical Geography of the Sea (1855 edition): The primary object of the Wind and Current Charts, out of which has grown the Treatise on the Physical Geography of the Sea, was to collect the experience of every navigator as to the winds and currents of the ocean, to discuss his observations upon them, and then to present the world with the results on charts for the improvement of navigation. Accordingly, when this object was made known, an appeal was addressed to the mariners, there was a flight up into the garrets, and a ransacking of time-honored sea-chests in all the maritime communities of the country for old log-books and journals. It was supposed that the records therein contained as to the wind and weather, the sea and its currents, would afford information requisite for such an undertaking. By putting down on a chart the tracks of many vessels on the same voyage but at different times, in different years, and during all seasons, and by projecting along each track the winds and currents daily encountered, it was plain that the navigator hereafter, by consulting this chart, would have for a guide the results of the combined experience of all those whose tracks were thus pointed out (p. V). While Maury’s work was trailblazing, it was not sufficient for all the world’s navigators. The best format for communicating so much information was a matter of debate. Maury had different charts, some which had the tracks of dozens of voyages that overlapped and others, which he called pilot charts, that utilized a grid system and included circular tables of wind measurements split into the three separate watches of a day at sea. Maury was not the first to devise circular diagrams to communicate atmospheric data. Von Buch (1819), H. W. Buek (1826), and H. W. Dove (1837) all created enhanced compass roses to include information about atmospheric pressure or wind direction. Abraham Follett Osler, who ran a glass manufacturing firm in Birmingham, England, was an amateur scientist interested in collecting meteorological data. In 1840, Osler had devised a set of charts that used compass roses to communicate information about the wind in a certain area. He presented his work to the British Association for the Advancement of Science. Brault took up this idea and perfected it, creating a figure that communicated wind direction and intensity and the quality of data for a specific place quickly and clearly. Today, this sort of wind rose is called a Baillie Rose, named by Sir Napier Shaw after Charles William Baillie of the Royal Navy, who continued to experiment with the idea after Brault’s death in 1885." (Katherine Parker, Ruderman, 2022)
Pub List No:
15038.000
Pub Type:
Chart Map
Pub Height cm:
65
Pub Width cm:
92
Image No:
15038000.jp2
Authors:
Brault, Louis-Deìsireì-Leìon (1839 - 1885) ; Depot de la Marine