- Featured Maps
- October 11, 2009
Carte de France - The National Survey of France 1750 - 1815
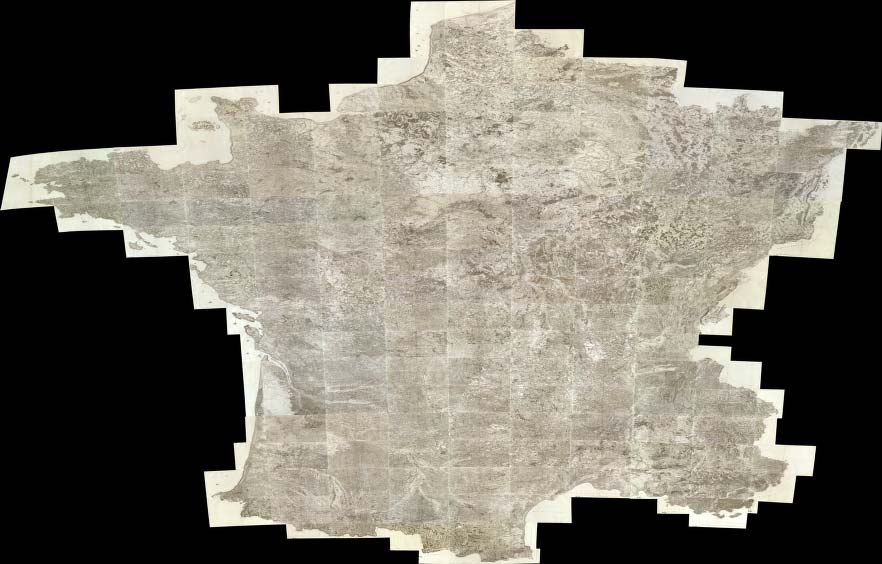
The Carte de France was one of the first national surveys completed on the same scale, 100 toises (a toise was equal to 6ft and the equivalent scale today would be 1:86,400), according to a specific plan. It was led by several generations of the Cassini family (not to be confused with the Italian globemaker Giovanni M. Cassini) starting in the 1740's and continuing through the French revolution and Napoleon's time, to 1815. Four generations of the Cassini family held the position of director of the Paris Observatory, and three of those worked on the Carte de France: Jacques Cassini (Cassini II, 1677-1756); Cesar-Francois Cassini (Cassini III, 1714-1784); and Jean Dominique Cassini (Cassini IV, 1748-1845). The 182 sheets that comprise the map are superb examples of cartographic engraving. The use of trigonometric surveying techniques gave the map a high degree of accuracy for its time. The sheets can therefore be joined together to present a unified view of France in the 18th century. In the view below, they are joined digitally - if they were physically joined together they would form a map about 39 feet high by 38 feet wide:
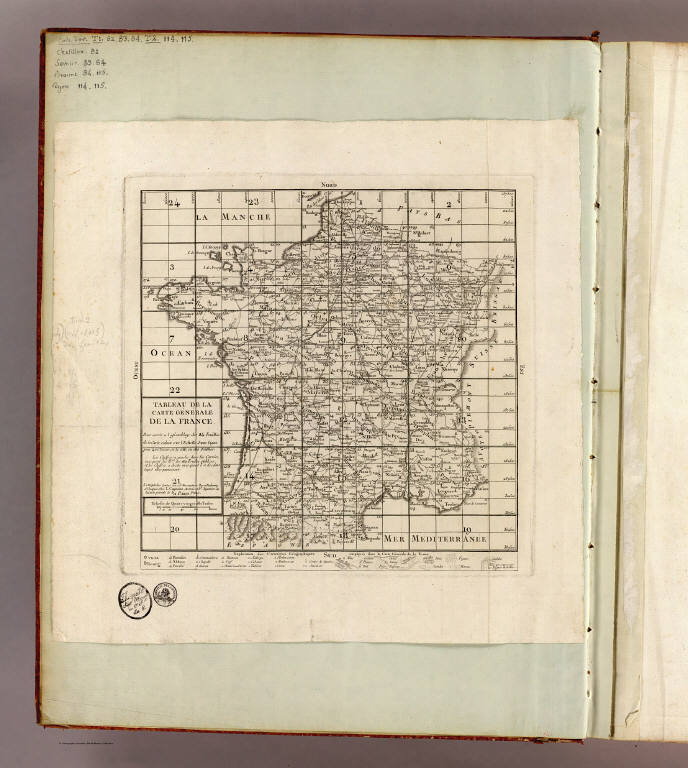
The Tableau de la Carte Generale de la France by Louis Capitaine shows the plan of dividing the country into map sheets:
At the bottom of the Tableau is an Explication des Caracteres Geographiques employes dans la Carte Generale de la France, which is a key to the symbols used in the 182 sheet map - there are no keys on the sheets themselves. As such, it is invaluable in understanding the cultural information on the maps. A portion of the key is shown below in detail (click on the image to see the full key). Additional explanations of the map symbols can be found on this site.
The plan for the triangulation survey is shown clearly in the Nouvelle carte qui comprend les principaux triangles... published in 1744 by Cesar-Francois Cassini and Giovanni Domenico Maraldi:
The first sheet published was centered on Paris, with the prime meridian running through the Paris Observatory and titled Carte de France Levee par ordre du Roy Premiere Feuille:
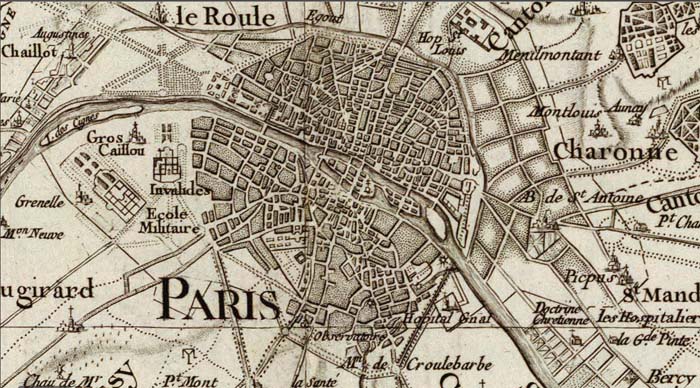
This close up of sheet 1 shows Paris and the meridian passing through the Paris Observatory. It also gives a good sense of the rich cultural information shown on the sheets (click to open in a new window with zoom and pan):
The production of the atlas sheets continued for about 65 years, to 1815. The cartographic style changed somewhat over that period, with slightly different symbols used for cultural and natural features at different times. Yet the map still has a consistency that that is impressive for such a long project. A version of the map on a reduced scale of 400 toises (1:345,600) on 24 sheets was published in 1790:
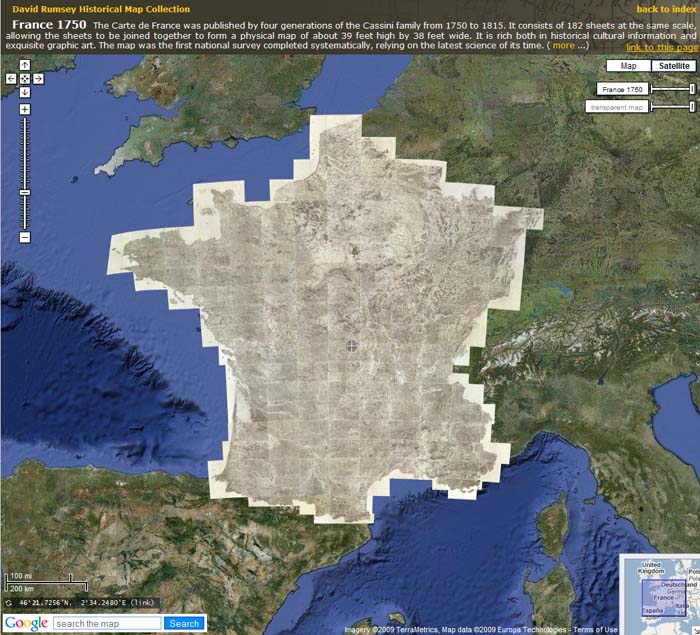
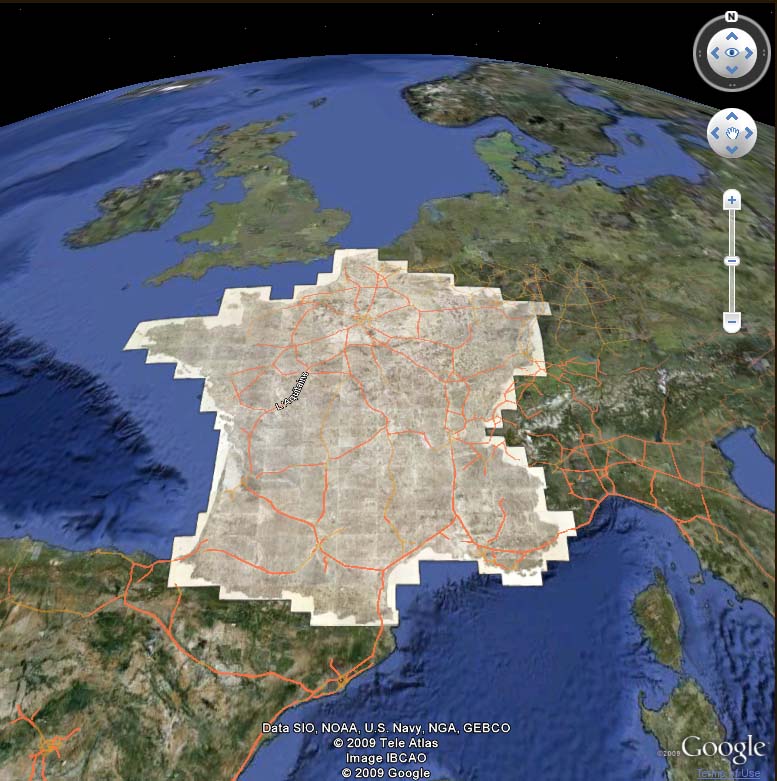
We have georeferenced both the 100 and 400 toises issues of the Carte de France and put them in Google Maps and in Google Earth. Below is the 100 toises scale map in Google Maps (click on the image to open in Google Maps). The 400 toises reduced scale map can also been seen in Google Maps.
The Carte de France in Google Maps and Google Earth can be searched by location, for example (in Google Maps) Marseilles, or Bordeaux, or Paris Environs, or regions like Brittany.
The 100 toises scale map in Google Earth is below (requires Google Earth app). The 400 toises scale map can also be viewed in Google Earth.
4 Comments on Carte de France - The National Survey of France 1750 - 1815
Can we do the same with our atlas chorographique de la Belgique of the same Louis Capitaine.
Is there a family of Capitaine du Chesnoy cartographers …?
Is it possible to know how the Cassini sheets were georeferenced, exactly:
- what were the points used on Cassini sheets for georeferencing? - what was the present day map used for finding the actual coordinates of these georeferencing points? - what was the transformation used for georeferencing ?
Thank you in advance!
The sheets were georeferenced using ESRI’s ArcMap, 3rd order polynomial transformation with points matching cities on the Cassini sheets to cities on the GAZ.SDC layer from the Defense Mapping Agency Digital Chart of the World. About 650 points were used with a total RMS error of about .005 The resulting image was in Geographic projection, GCS_WGS_1984 with a Datum of D_WGS_1984, for use in Google Earth.



The Worthy result. If possible. Who and what has done. Thank you.